

KEEPING A BALANCED APPROACH
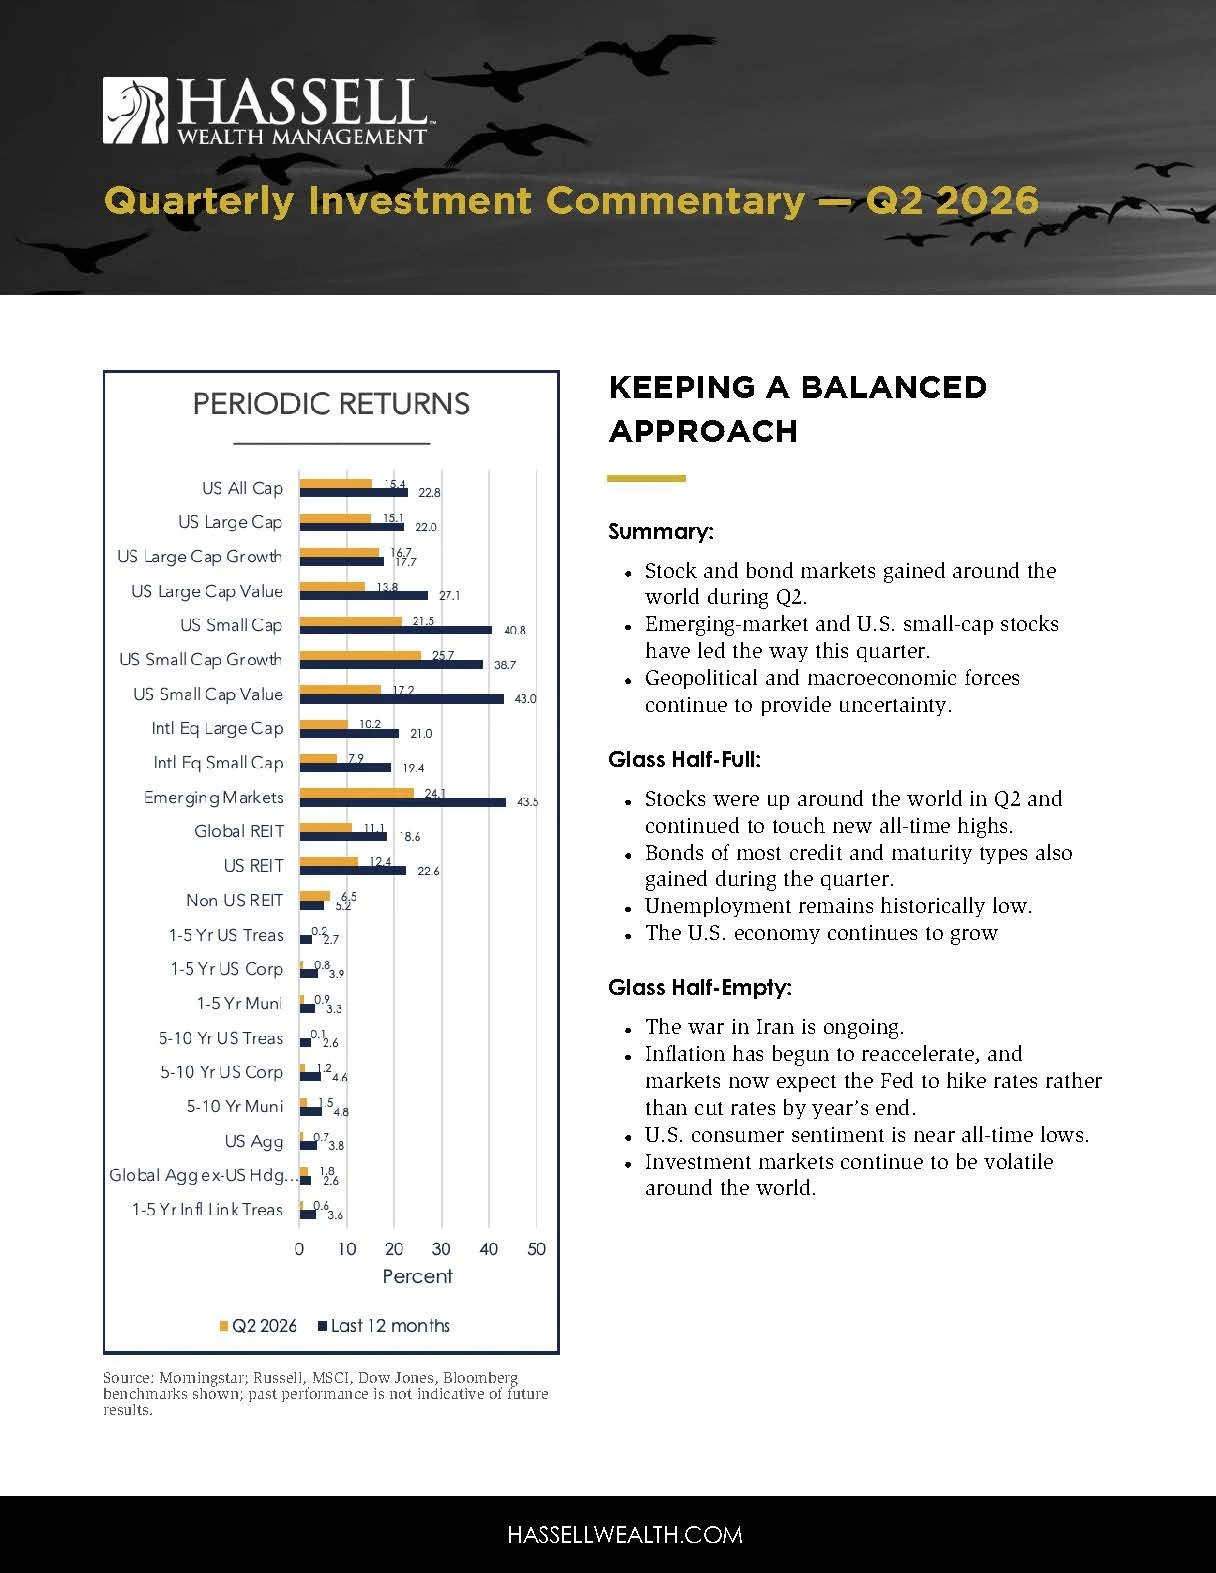
Source: Morningstar; Russell, MSCI, Dow Jones, Bloomberg benchmarks shown; past performance is not indicative of future results.
Summary:
Stock and bond markets gained around the world during Q2.
Emerging-market and U.S. small-cap stocks have led the way this quarter.
Geopolitical and macroeconomic forces continue to provide uncertainty.
Glass half-full:
Stocks were up around the world in Q2 and continued to touch new all-time highs.
Bonds of most credit and maturity types also gained during the quarter.
Unemployment remains historically low.
The U.S. economy continues to grow.
Glass half-empty:
The war in Iran is ongoing.
Inflation has begun to reaccelerate, and markets now expect the Fed to hike rates rather than cut rates by year’s end.
U.S. consumer sentiment is near all-time lows.
Investment markets continue to be volatile around the world.
Watch the video commentary.
Q2 2026 by the numbers
78% is the market-implied probability of a Federal Reserve rate hike by the December 2026 meeting of the Federal Open Market Committee (FOMC). After beginning the year with markets expecting rate cuts, expectations shifted meaningfully as Kevin Warsh made inflation control a clear priority in his first meeting as Fed Chair.
22.6% is the Russell 2000’s return during the first half of 2026, making it the best first half of a calendar year in decades for U.S. small-cap stocks.
$85.7 billion is the record-breaking amount raised by SpaceX after its initial public offering (IPO) in June. Its performance has been mixed since its stock market debut.
+7.3% is the year-to-date (YTD) return of a portfolio comprising 60% MSCI ACWI and 40% Bloomberg Global Aggregate (hedged USD). In other words, despite unnerving headlines and increased market volatility, a globally balanced portfolio comprising both stocks and bonds has performed well so far this year.
Economic Indicators Point Toward Growth
Inflation-adjusted U.S. gross domestic product (GDP) growth measures show that the economy grew by 2.1% during Q1, with preliminary estimates for Q2 growth settling at 1.3%.
Core PCE inflation reaccelerated during the quarter and remains elevated relative to the Fed’s 2% long-term target.
Unemployment ticked down to 4.2% to end the quarter.
The U.S. economy continues to present a mixed but generally resilient picture across inflation, growth, and employment as shown in Exhibit 1. Core PCE inflation has remained near 3.0% in recent months and has begun to reaccelerate, keeping it above the Federal Reserve’s 2% target. Elevated energy prices have contributed to this pressure. Against that backdrop, the Fed left the federal funds rate unchanged at its June meeting, the first chaired by newly appointed Fed Chairman Kevin Warsh.
Economic growth has strengthened relative to prior periods, with the final estimate for first-quarter 2026 real GDP growth coming in at 2.1%. According to the U.S. Bureau of Economic Analysis, the upward revision was driven in part by a reduction in imports, which adds to the GDP calculation. Consumer spending weakened during the quarter, potentially reflecting the decline in consumer sentiment, while the Atlanta Fed’s most recent estimate placed second-quarter growth at 1.3%.
The unemployment rate edged lower from the previous quarter but remained slightly above its level from a year ago. Even so, it continues to sit near historically low levels. Taken together, these indicators suggest that the U.S. economy is still expanding, although the Federal Reserve faces a delicate balancing act: bringing inflation back toward its long-term 2% target without slowing growth enough to cause a meaningful rise in unemployment.
Exhibit 1
Source: St. Louis Federal Reserve, BLS, BEA. Core PCE readings are as of 5/31/26, 2/28/26, and 5/31/25. Inflation-adjusted GDP growth readings are as of 1/31/26, 10/31/25, and 1/31/25. Unemployment rate readings are as of 6/30/26, 3/31/26, and 6/30/25.
The Fed: Change in Leadership and Expectations
Exhibit 2 highlights how dramatically market expectations for Federal Reserve policy have shifted over the course of the year. At the beginning of 2026, markets were assigning a very high probability to a rate cut by year’s end, suggesting that investors expected the Fed to have room to ease policy as inflation pressures moderated or growth cooled. However, those expectations changed meaningfully in March when the war in Iran began to influence energy prices and inflation expectations upward as the year progressed. The probability of a rate cut began to fall sharply, and the market increasingly expected either no change to the federal funds rate or, more recently, a rate hike. By late June, the market-implied probability of a rate hike had risen to roughly 78%, while the probability of a rate cut had essentially disappeared. Rate hikes can make borrowing more expensive for companies and consumers, which can dampen economic growth.
The most recent meeting was Kevin Warsh’s first as Fed Chair, and his public post-meeting comments made clear that taming inflation is a top priority. Other Fed officials supported Chair Warsh’s remarks and commented that if future inflation readings continued to increase, a rate hike could be reasonable. The Fed acknowledged that some of the recent inflation pressure was being influenced by higher oil prices, tariffs, and the artificial intelligence build-out, which has contributed to strong business investment and demand in certain parts of the economy.
This ongoing dynamic reinforces the idea that the Fed remains in a difficult position: It must bring inflation back toward its long-term target without overtightening to the point where economic growth slows materially or unemployment begins to rise. It also reminds us of why, similar to stock markets, we don’t try to time bond markets, as expectations can change rapidly.
Exhibit 2
Source: CME FedWatch. Chart displays market-implied probability of rate decisions for December 2026 FOMC meeting.
Consumer Sentiment and Stock Market Divergence
Even with continued stock market growth during recent periods, positivity among U.S. consumers has not followed suit. Exhibit 3 shows a meaningful disconnect between how consumers feel about the economy and how the stock market has performed. The blue line tracks the University of Michigan's Consumer Sentiment Index with values on the left-hand side, while the green line tracks the S&P 500 price level on the right-hand side. Historically, these measures can move in the same general direction because strong markets often coincide with better confidence, stronger job growth, and optimism about future economic conditions. However, beginning sometime last year, they have moved in very different directions. The S&P 500 has continued to climb and reach new highs, while consumer sentiment has deteriorated and remained weak, near all-time lows.
A key reason for this disconnect might be that the stock market and consumers are responding to different parts of the economy. Stock markets are forward-looking and have been supported by strong corporate earnings, enthusiasm around artificial intelligence, resilient business investment, and expectations that the economy can continue growing despite higher interest rates. In contrast, consumers are more directly affected by the day-to-day experience of the economy, including higher prices, elevated borrowing costs, housing affordability challenges, and uncertainty about whether inflation will continue to pressure household budgets.
The main takeaway is that strong stock market performance does not always mean consumers feel confident about the economy. This disconnect is important because consumer sentiment can influence spending behavior, and consumer spending remains a major driver of the U.S. economy.
Exhibit 3
The Return of the Mega-Cap IPO
Another notable trend from Q2 came from the IPO market. The Elon Musk-founded company SpaceX began trading on the Nasdaq stock exchange on June 12 following its highly anticipated initial public offering, where it raised a record-breaking $85.7 billion and valued the company at $1.8 trillion. IPOs provide investors the opportunity to acquire shares of a private company as it begins listing on an exchange as a publicly traded company. And given the massive size of the SpaceX IPO, along with its well-known CEO, it garnered a lot of interest among investors looking to gain access to the shares prior to its listing in hopes of seeing SpaceX soar further in price.
The company’s stock price launched skyward quickly upon listing, only to come back down to earth just as fast, finishing the quarter about 6% above its opening price. According to a study by University of Florida professor Jay Ritter, also known as “Mr. IPO” because of his extensive research in this area, which looked at over 9,000 IPO listings that debuted between 1980 and 2024, this phenomenon is quite common. The average first-day return for IPO listings during this period was 18.9% and represents the “first-day pop” typically associated with IPOs because of pent-up investor demand and limited share supply. However, on average, these IPOs go on to return only 5.6% in their first year post-listing and actually trail the broader U.S. stock market by 20.5% during the first three years. So, while the initial excitement and fear of missing out can drive investors to seek an allocation to high-flying IPOs, the reality is that a well-diversified, globally balanced portfolio often serves investors better over the long term.
And even in a well-diversified portfolio, SpaceX may already be a part of that mix in certain U.S. stock funds. Its specific weighting in an index fund that tracks the total U.S. stock market will vary depending on index construction rules, but its initial weight is likely to be less than half of a percent of the fund, and an even smaller portion of an investor's overall portfolio.
In addition, analysis by Truist looked at the returns and maximum drawdowns during the first 12 months of trading for 30 other notable tech IPOs over the past few decades. The findings are similar to Professor Ritter’s studies and also highlight the risk of single-stock investing. For example, Facebook, now called Meta, lost 31% of its value after one year of trading. The average 12-month return for these 30 companies was 15% even though fewer than half of their 12-month returns were positive. The median return, which controls for extreme outliers of the group, was -9%.
What’s more staggering is that the maximum drawdown for each company, which measures the absolute return from peak value to worst value during the period, was at least -20%, with the average being -55%. Facebook lost 54% during its worst stretch. Even the best 12-month performer in the analysis, Palantir, which gained 153% overall, suffered a 53% drawdown along the way.
This reinforces the idea that taking single-stock risk in a portfolio will drive increased volatility and risk a significant loss of wealth that a diversified portfolio attempts to avoid.
U.S. Equity
U.S. stocks were up for Q2, gaining 15.4%, and were led by small-cap stocks. Small-cap growth stocks gained the most at 25.7%.
The U.S. stock market shows strong returns for the past 12 months at 22.8%, with small-cap value stocks gaining 43.0%. U.S. large-cap growth stocks gained the least during the same period, returning 17.7%.
Looking at domestic small-cap stocks, Exhibit 4 puts the recent strength in U.S. small-cap stocks into longer-term historical context. The Russell 2000 index, a popular measure for U.S. small-cap stocks, gained 22.6% during the first half of 2026, which makes it one of the strongest periods among beginning and ending calendar year halves for U.S. small-cap stocks since 1980 and the best first half of a calendar year in decades.
While small caps have experienced several extended periods of underperformance relative to large-cap stocks, this data shows that when the asset class turns, the rebound can be powerful and occur quickly. The first half of 2026 saw a small-cap rally aided by companies linked to the AI build-out, such as microchip and semiconductor companies. The top-two-performing companies year-to-date in the index were related to IT services and healthcare. In addition, the Russell 2000 is now outperforming its large-cap index peer, the Russell 1000, by over 4% for the past two years annualized.
The key takeaway is that small caps can pack a large punch over relatively short time periods. Investors who abandon the asset class after disappointing performance risk missing the early stages of a recovery, which can account for a meaningful portion of long-term returns. The strong first half of 2026 is a reminder that small-cap exposure can provide valuable diversification and return potential.
Non-U.S. Equity
Broad developed and emerging non-U.S. stock market returns were positive for Q2, with emerging-market stocks returning the most at 24.1% for the quarter and 43.5% for the last year, leading global stock asset classes for each period.
Large-cap growth stocks returned the most among international developed markets for the quarter at 12.6%, while large-cap value stocks returned the most for the category for the past 12 months at 29.3%.
While international developed markets trailed the U.S. stock market last quarter and are now just behind for the past 12 months, emerging-markets stocks continued to outpace developed stock markets around the world during Q2 and the past 12 months. In fact, the top-six-performing country stock markets for the past year are all emerging-market countries. And following a strong second quarter, Taiwan and South Korea really stand out and have surged 104% and 181% over the past year, respectively, now ranking among the world’s 10 largest country stock markets. Taiwan is now the world’s third-largest stock market, overtaking the United Kingdom, while South Korea has climbed to sixth place.
Much of this performance has been driven by semiconductor companies such as TSMC, Samsung, and SK Hynix. Their remarkable returns are a reminder that strong outcomes can show up anywhere in the world. Will the stellar returns of Taiwan, South Korea, and emerging markets at large continue? And if so, for how long? We cannot know for sure. But diversified portfolios can allow investors to participate in global returns wherever and whenever they appear. By contrast, investors who pick and choose countries and regions to overweight or underweight might find themselves missing out.
Exhibit 4
Source: Morningstar. Returns data represents U.S. small-cap stock performances as measured by Russell 2000 Index. Returns data from 1/1/1980 to 6/30/26. Analysis looks at beginning and ending six-month calendar periods.
Global Real Estate Investment Trusts (REITs)
Global REITs, as represented by the Dow Jones Global Select REIT index, rose by 11.1% over the quarter and were up by 18.6% over the past 12 months.
In the U.S., REITs rose by 12.4% during the quarter and are up by 22.6% during the past 12 months.
Global Fixed Income
U.S. taxable bond returns were positive for Q2, with long-term Treasuries and intermediate-term corporate bonds returning the most at 0.8% and 1.2%, respectively. The U.S. aggregate bond index was up 3.8% for the past 12 months.
Short-term inflation-protected bonds gained the most of any U.S. Treasury bond type during the past 12 months (3.6%) as inflation increased during the period.
International bonds ex-US (hedged USD) were positive over the trailing quarter (1.8%), in which they outpaced U.S. bonds and were positive for the past 12 months (2.6%).
Intermediate-term municipal bonds were positive for the quarter (1.5%) and one-year trailing time periods (4.8%).
Exhibit 5
Source: Bloomberg, Avantis. Data as of 6/30/26.
Exhibit 5 shows the changes in yields for U.S. Treasuries of various maturities by comparing Q2 quarter-end yields (dark blue line) against yields from the previous quarter-end (green line) and this time last year (light-blue line). Compared with last quarter-end, yields for U.S. Treasuries increased across the yield curve. Yields of almost all maturities also increased during the 12 months ending June 30, with the exception of ultrashort maturities. Yield increases were most pronounced among intermediate maturities. While this yield movement may have muted performance in recent periods, expected returns are now higher going forward as a result of higher yields.
Exhibit 6
Source: Bloomberg, Avantis. Data as of 6/30/26.
Exhibit 6 shows the same analysis but for municipal bonds. Importantly, the muni curve is shaped differently from the Treasury curve. Different factors drive each market and highlight how different types of bonds can move differently at various times and for different reasons. Muni yields dropped relative to last quarter and last year for all maturities shown. This supported positive muni bond performance during the trailing quarter and one-year time periods. However, this has also lowered expected returns for muni bonds going forward relative to prior periods.
Overall, we continue to view our bond allocations as a method of reducing overall portfolio risk (as measured by standard deviation), given that stocks are expected to have much higher volatility. Our portfolio’s focus will continue to be on high-quality bonds with an emphasis on short- to intermediate-duration government and corporate bonds, where default risk has historically been relatively low.
East Bay Investment Solutions, a Registered Investment Advisory firm, supplies investment research services under contract.
This document contains general information, may be based on authorities that are subject to change, and is not a substitute for professional advice or services. This document does not constitute tax, consulting, business, financial, investment, legal or other professional advice, and you should consult a qualified professional advisor before taking any action based on the information herein. This document is intended for the exclusive use of East Bay clients, and/or clients or prospective clients of the advisory firm for whom this analysis was prepared in conjunction with the EAST BAY TERMS OF USE, supplied under separate cover. Content is privileged and confidential. Information has been obtained by a variety of sources believed to be reliable though not independently verified. To the extent capital markets assumptions or projections are used, actual returns, volatility measures, correlation, and other statistics used will differ from assumptions. Historical and forecasted information does not include advisory fees, transaction fees, custody fees, taxes or any other expenses associated with investable products unless otherwise noted. Actual expenses will detract from performance. Past performance does not indicate future performance.
The sole purpose of this document is to inform, and it is not intended to be an offer or solicitation to purchase or sell any security, or investment or service. Investments mentioned in this document may not be suitable for investors. Before making any investment, each investor should carefully consider the risks associated with the investment and make a determination based on the investor’s own particular circumstances, that the investment is consistent with the investor’s investment objectives. Information in this document was prepared by East Bay Investment Solutions. Although information in this document has been obtained from sources believed to be reliable, East Bay Investment Solutions does not guarantee its accuracy, completeness, or reliability and are not responsible or liable for any direct, indirect or consequential losses from its use. Any such information may be incomplete or condensed and is subject to change without notice.
Visit eastbayis.com for more information regarding East Bay Investment Solutions.