
KEEPING A BALANCED APPROACH
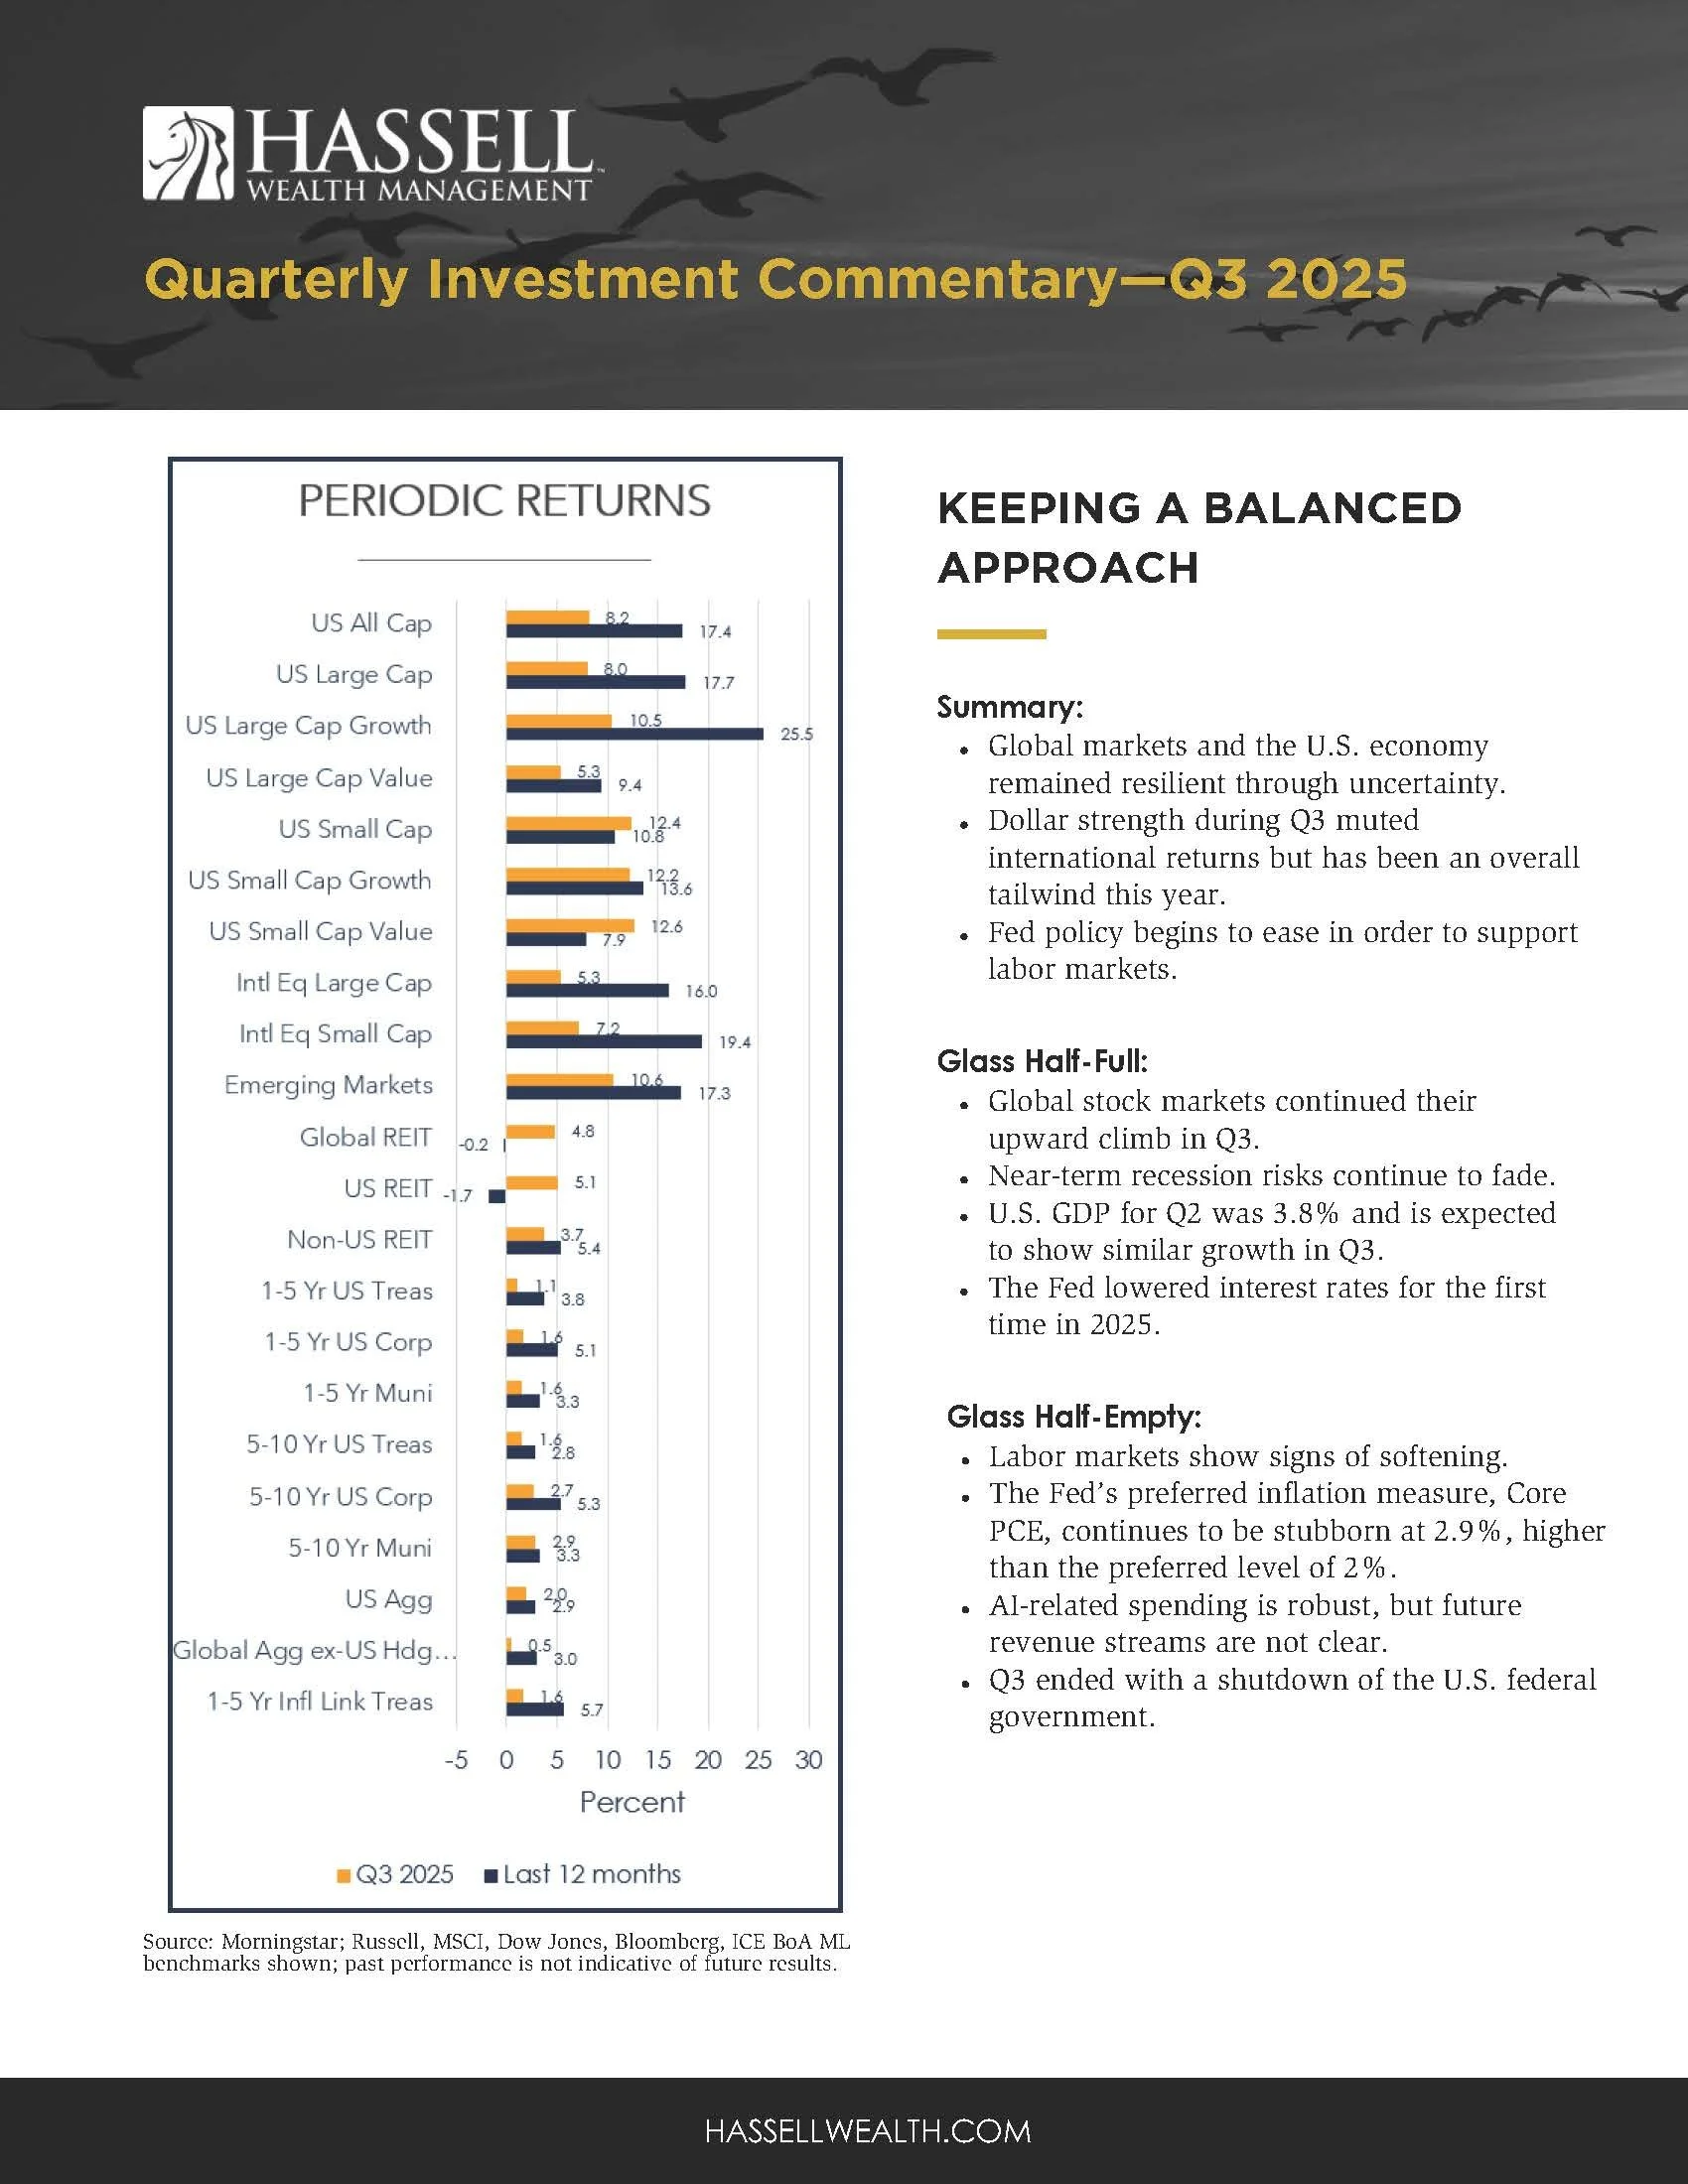
Source: Morningstar; Russell, MSCI, Dow Jones, Bloomberg, ICE BoA ML benchmarks shown; past performance is not indicative of future results.
Summary:
Global markets and the U.S. economy remained resilient through uncertainty.
Dollar strength during Q3 muted international returns but has been an overall tailwind this year.
Fed policy begins to ease in order to support labor markets.
Glass half-full:
Global stock markets continued their upward climb in Q3.
Near-term recession risks continue to fade.
U.S. GDP for Q2 was 3.8% and is expected to show similar growth in Q3.
The Fed lowered interest rates for the first time in 2025.
Glass half-empty:
Labor markets show signs of softening.
The Fed’s preferred inflation measure, Core PCE, continues to be stubborn at 2.9%, higher than the preferred level of 2%.
AI-related spending is robust, but future revenue streams are not clear.
Q3 ended with a shutdown of the U.S. federal government.
Watch the video commentary.
Q3 2025 by the numbers
4.00% - 4.25% represents the current policy target range for the federal funds rate set by the Federal Reserve. As the Fed lowers rates, it has mixed implications for longer-term rates and financing costs for consumers.
$211 billion is the cumulative amount of capital estimated to have been spent on artificial-intelligence projects by the end of last year by major technology companies. So far, markets have rewarded this behavior, but eventually, profits will need to follow.
+0.11% is the average S&P 500 index performance during prior federal government shutdowns.
+12.6% is the YTD return of a portfolio comprising 60% MSCI ACWI and 40% Bloomberg Global Aggregate (hedged USD). In other words, despite the unnerving headlines so far this year, a globally balanced portfolio comprising both stocks and bonds is now trailing the S&P 500 by 2.2% YTD.
An Unfolding Tariff Timeline
Real GDP grew at an annual rate of 3.8% in Q2, with similar growth expected in Q3.
Labor markets show signs of softening as 911,000 fewer jobs were added to the economy than first thought.
So far this year, predictions of a recession in the U.S. stemming from the sweeping tariff policies first proposed in April have yet to drag the U.S. economy down.
In fact, the latest reading for real GDP growth (or the inflation-adjusted value for all goods and services produced in the U.S.) came in at a 3.8% annualized rate in the second quarter. And for now, that trend is expected to continue based on the Atlanta Fed’s GDPNow model forecasting 3.8% growth for the third quarter.
And while there are many nuances to these statistics, the latest GDP reading shows a large contribution came from 4.8% due to net exports, meaning the country sold more goods and services abroad than it bought. We also saw a 3.4% reduction in private company inventories, which means that companies have been selling their products faster than they have been making them.
Together, these data points might imply that companies and consumers are producing and consuming more domestically compared with history and that the stockpile of cheaper, pre-Liberation Day inventories is being depleted. While our crystal ball remains cloudy, when these inventories run too low and if companies choose to pass on the increased costs to consumers, it’s not unreasonable to expect that inflation might reignite and that consumer demand will decrease, negatively impacting economic growth.
Nevertheless, the U.S. economy has picked up steam so far this year, but with curious developments in the labor market. Last quarter brought significant downward revisions to prior months’ job gains, meaning that the labor market is considerably weaker now than it was entering the summer and that companies hired far less than expected.
According to the Bureau of Labor Statistics, the economy added 911,000 fewer jobs during the 12 months ending in March 2025 than was previously thought. These sorts of revisions, referred to as “benchmark” revisions, are not uncommon, but the size of this downward revision was the largest since 2002. The latest reading for unemployment ticked up 0.2% compared with last quarter but remains very low, at 4.3%, compared with historical standards.
This reduction of labor as companies roll back their job postings has been met with a reduction in labor supply through lower immigration, fewer workers voluntarily quitting their jobs, and companies being less inclined to lay off workers. Together, this suggests that U.S. companies are in a “no hire, no fire” stance as they are waiting for more economic clarity.
Can the Fed Maintain Balance?
The Federal Open Market Committee, which is the Federal Reserve’s rate-setting body, lowered the fed funds rate for the first time this year by a quarter percent, bringing the new federal funds rate policy range to between 4.00% and 4.25%. And markets now widely expect another two rate reductions by the end of the year. However, the Fed’s preferred inflation gauge (the Core Personal Consumption Expenditures index) has been particularly stubborn in reaching the Fed’s long-term goal of 2%. In fact, it ticked up slightly during the last quarter to 2.9%.
Meanwhile, the Fed cited a weakening labor market as a reason to resume cutting rates. This highlights the difficult situation that the Fed continues to find itself in. They can reduce short-term rates to support the labor market, but how far will they be willing to go while attempting to conquer inflation, especially as lower rates can lead to more growth and possibly more inflation? Markets will continue to pay close attention to both what the Fed does and what it says between meetings.
Fed Action and Market Moves
It is reasonable to ask how Fed interest rate decisions, which directly influence ultra-short maturities, impact the entirety of the U.S. government yield curve and other interest rates.
As depicted in Exhibit 1, dating back to the early 1980s, when the Fed moved the federal funds rate up or down, the 10-year Treasury yield, which is a closely watched benchmark rate, moved in the same direction roughly two-thirds of the time. This is shown in the bottom-left and upper-right areas of the graphic. However, the 10-year yield moved in the opposite direction about one-third of the time. This is because longer-term yields, like the 10-year, tend to be more influenced by expectations for economic growth and inflation rather than short-term interest rate decisions. As a result, for example, if you are in the market for a mortgage, whose rates are loosely tied to the 10-year yield, it is not a foregone conclusion that mortgage rates will decline just because the Fed lowered rates.
Exhibit 1
Source: Dimensional Fund Advisors, Federal Reserve Economic Data (FRED) from the Federal Reserve Bank of St. Louis. Data series used: Market Yield on US Treasury Securities at 10-Year Constant Maturity, Quoted on an Investment Basis, Percent, Daily, Not Seasonally Adjusted (DGS10); Federal Funds Target Rate (DISCONTINUED), Percent, Daily, Not Seasonally Adjusted (DFEDTAR); and Federal Funds Target Range - Upper Limit, Percent, Daily, Not Seasonally Adjusted (DFEDTARU). Circles corresponding to a rate cut do not sum to 100% due to monthly periods of no yield change for the 10-Year US Treasury note.
Ultimately, this graphic shows that the Fed does not have direct control over longer-maturity interest rates and that the federal funds rate is not a reliable predictor of where longer-term interest rates will go.
There is also an ongoing narrative that a reduction in interest rates is expected to give stock performance an extra boost. This relationship makes sense given that lower rates will likely reduce the cost of financing for companies as well as consumers. However, as Exhibit 2 illustrates, this dynamic might not be as powerful as it is portrayed in financial media.
Exhibit 2, Average Monthly Return: U.S. Stock Market
Source: Avantis. Data from 1973 - 2024. U.S. stocks are represented by the Market Portfolio from Ken French’s Data Library. The total rolling one-year periods in the analysis are 613. Total rolling 1-year periods when rates rise by >1% are 93, periods when rates fall by >1% are 93, and periods when rates stay within +/- 1% are 410.
According to this research conducted by Avantis, stocks did indeed perform better when the yield on the 10-year treasury fell by more than 1%. However, stock performance during periods where yields stayed relatively flat or increased by more than 1% is not that different. And given how quickly markets adjust prices with new information, investors would have to have quicker access to information than broader markets to succeed. This chart shows that making portfolio changes when interest rates change has not been that impactful to overall returns.
U.S. Equity
U.S. stocks were positive for Q3 gaining 8.2% fueled in part by a small-cap stock rally. Small-cap value stocks gained the most at 12.6%.
Large-cap growth stocks lead the pack YTD (+17.2%) as trade and tariff uncertainty weighed more heavily on small-cap and value stocks earlier in the year.
During the past 12 months, all U.S. stock segments have been positive.
While small-cap value stocks led the pack this quarter, the U.S. stock market has been largely supported by large technology-focused companies over longer periods.
Companies have been producing massive amounts of semiconductor chips and other supporting infrastructure to fuel the growth of artificial intelligence as the next potential technology to boost society’s productivity. Markets have grown accustomed to seeing eye-popping dollar figures associated with AI-related spending being announced by "AI hyper-scalers,” such as Alphabet, Amazon, Meta, Microsoft, and Oracle, totaling in the hundreds of billions over the next several years.
Markets also acknowledge that huge sums of capital are necessary to bring AI to the masses, but the return on investment will also need to be significant, and there has been little in terms of concrete numbers to bring clarity on what future revenue streams will look like. If the cost to support AI does not bring dramatic returns on the initial investments made by these companies, that's a risk to investors who concentrate portfolios around these companies.
These large-growth technology companies have become increasingly expensive over the past several years, which has introduced heightened concentration risk, or the idea that so few companies have an outsized influence on market performance.
Exhibit 3 shows that today’s top 10 S&P 500 companies are more expensive, based on the 12-month forward P/E ratio, than the top 10 were in the late 1990s and early 2000s before the internet bubble burst. The same is true for the index more broadly. Just like the AI revolution of the 2020s, the internet revolution of the 1990s touted generational change, and in hindsight, it's fair to say that the internet delivered on its promises. While the future is unknowable, the same might be true for AI, and it's also not unreasonable to expect that it could happen with the same fall-back-to-earth dynamic as when the internet bubble burst.
Exhibit 3
Source: Bloomberg, Apollo Chief Economist. Top 10 companies are by market cap. Data as of July 2025.
Non-U.S. Equity
Developed and emerging non-U.S. stock market returns were all positive for Q3 and all periods during the past 12 months.
International developed large-cap value stocks returned the most during the past 12 months at 22.9%, while small-cap value stocks show the best YTD performance of 31.9%.
While international developed stocks underperformed their U.S. counterparts last quarter, they hold a substantial lead so far YTD and are on near-equal footing for the last 12 months. And at least part of that has been supported by a falling U.S. dollar. This phenomenon is not unique to 2025. In portions of each decade from the mid-to late 70s through this year, when the dollar has a broad, sustained decline compared with other major global currencies, U.S. investors who hold investments priced in international currencies will see a boost in returns.
To put YTD 2025 into actual numbers, investing in a broad international-developed stock benchmark like the MSCI EAFE index in local currency on a YTD basis has generated a return of 13.6%. But as U.S. investors, the overall decline of the U.S. dollar YTD has been a benefit, and the return of the MSCI EAFE in USD has been a much higher 25.1%. In other words, the benefit that U.S. investors are seeing today from a declining dollar is having the opposite impact from when the U.S. dollar was increasing relative to a basket of other currencies.
Looking back at market history, there have been periods where the dollar declined and international developed stocks outpaced U.S. stocks on a trailing three-year horizon, sometimes by 30% or more. To be fair, the opposite is also true, but this dynamic can be helpful to those who are particularly sensitive or fearful to declines in the U.S. dollar.
Nonetheless, the dollar remains strong today relative to the last 20 years.
Shifting to the next forward-looking, long-term horizon, movements in the U.S. dollar and all other currencies tend to wash out over time in terms of their impact on returns. But recent valuations compared with history give clues as to where returns might come from in the future.
To put it simply, the higher valuations are today, the lower expected future returns are during the next long-term period. Starting around 2008-2009, during the tail end of the Great Financial Crisis, U.S. and international stock markets were valued roughly the same. But, as all investors are well aware, the U.S. stock market then began its decade-plus-long period of outperformance relative to international stocks. U.S. stocks have become about 50% more expensive relative to international stocks going forward. And while anything can happen in the short term, history tells us that U.S. stocks are unlikely to repeat their dramatic outperformance over the next long-term period.
Global REITs (Real Estate Investment Trusts)
Global REITs, as represented by the Dow Jones Global Select REIT, rose by 4.8% over the quarter but were down by -0.2% over the past 12 months.
In the U.S., REITs rose by 5.1% during the quarter but are down by -1.7% during the past 12 months.
Global Fixed Income
U.S. taxable bond returns were positive during Q3, YTD, and 12-month periods, with intermediate corporate bonds gaining the most during the quarter at 2.7% and short-term inflation-protected bonds gaining the most during the past year at 5.7%.
Global bonds ex-US (hedged USD) were also positive over the trailing quarter (0.5%) and 12-month periods (3.0%).
Short- to intermediate-term municipal bonds were also positive for the quarter and one-year trailing time periods, with intermediate-term munis up 3.3% for the past 12 months.
Focusing on recent Treasury yield curve changes in Exhibit 4, compared to last quarter-end, short term rates, which the Fed controls, fell over the quarter, while longer-term yields remained largely unchanged. You can also see that the shorter portion of the curve is still flat-to-inverted but begins to steepen on the longer end. Short-term yields dropped while intermediate- and longer-term yields rose over the 12 months ending September 30, hence the positive relative performance previously mentioned.
Exhibit 4
Source: Bloomberg, Avantis. Data as of 9/30/2025.
Regarding municipal bonds in Exhibit 5, short to intermediate bonds were positive for the quarter, YTD, and trailing one-year periods. However, longer-dated maturities rose during the past 12 months as rates moved higher, which led to a steeper municipal yield curve overall and impacted long-dated muni performance during that period. This highlights the fact that Treasuries and municipal bonds behave differently as they are exposed to different risks.
Exhibit 5
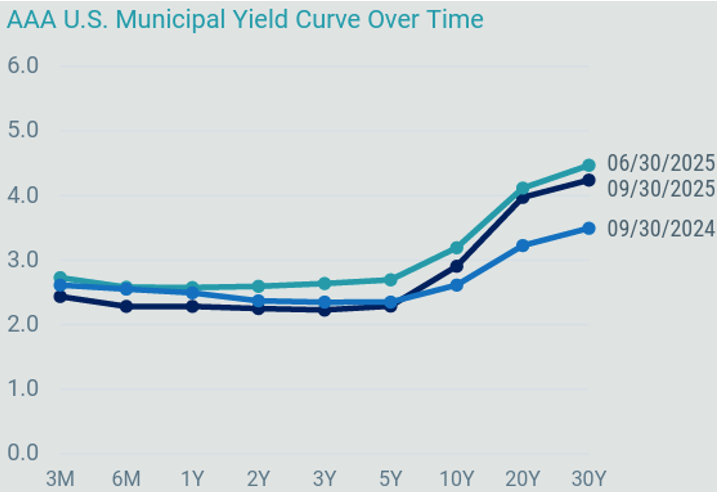
Source: Bloomberg, Avantis. Data as of 9/30/2025.
Overall, we continue to view our bond allocations as a method of reducing overall portfolio risk (as measured by standard deviation), given that stocks are expected to have much higher volatility. Our portfolio’s focus will continue to be on high-quality bonds with an emphasis on short- to intermediate-duration government and corporate bonds, where default risk has historically been relatively low.
East Bay Investment Solutions, a Registered Investment Advisory firm, supplies investment research services under contract.
This document contains general information, may be based on authorities that are subject to change, and is not a substitute for professional advice or services. This document does not constitute tax, consulting, business, financial, investment, legal or other professional advice, and you should consult a qualified professional advisor before taking any action based on the information herein. This document is intended for the exclusive use of East Bay clients, and/or clients or prospective clients of the advisory firm for whom this analysis was prepared in conjunction with the EAST BAY TERMS OF USE, supplied under separate cover. Content is privileged and confidential. Information has been obtained by a variety of sources believed to be reliable though not independently verified. To the extent capital markets assumptions or projections are used, actual returns, volatility measures, correlation, and other statistics used will differ from assumptions. Historical and forecasted information does not include advisory fees, transaction fees, custody fees, taxes or any other expenses associated with investable products unless otherwise noted. Actual expenses will detract from performance. Past performance does not indicate future performance.
The sole purpose of this document is to inform, and it is not intended to be an offer or solicitation to purchase or sell any security, or investment or service. Investments mentioned in this document may not be suitable for investors. Before making any investment, each investor should carefully consider the risks associated with the investment and make a determination based on the investor’s own particular circumstances, that the investment is consistent with the investor’s investment objectives. Information in this document was prepared by East Bay Investment Solutions. Although information in this document has been obtained from sources believed to be reliable, East Bay Investment Solutions does not guarantee its accuracy, completeness, or reliability and are not responsible or liable for any direct, indirect or consequential losses from its use. Any such information may be incomplete or condensed and is subject to change without notice.
Visit eastbayis.com or more information regarding East Bay Investment Solutions.