

KEEPING A BALANCED APPROACH
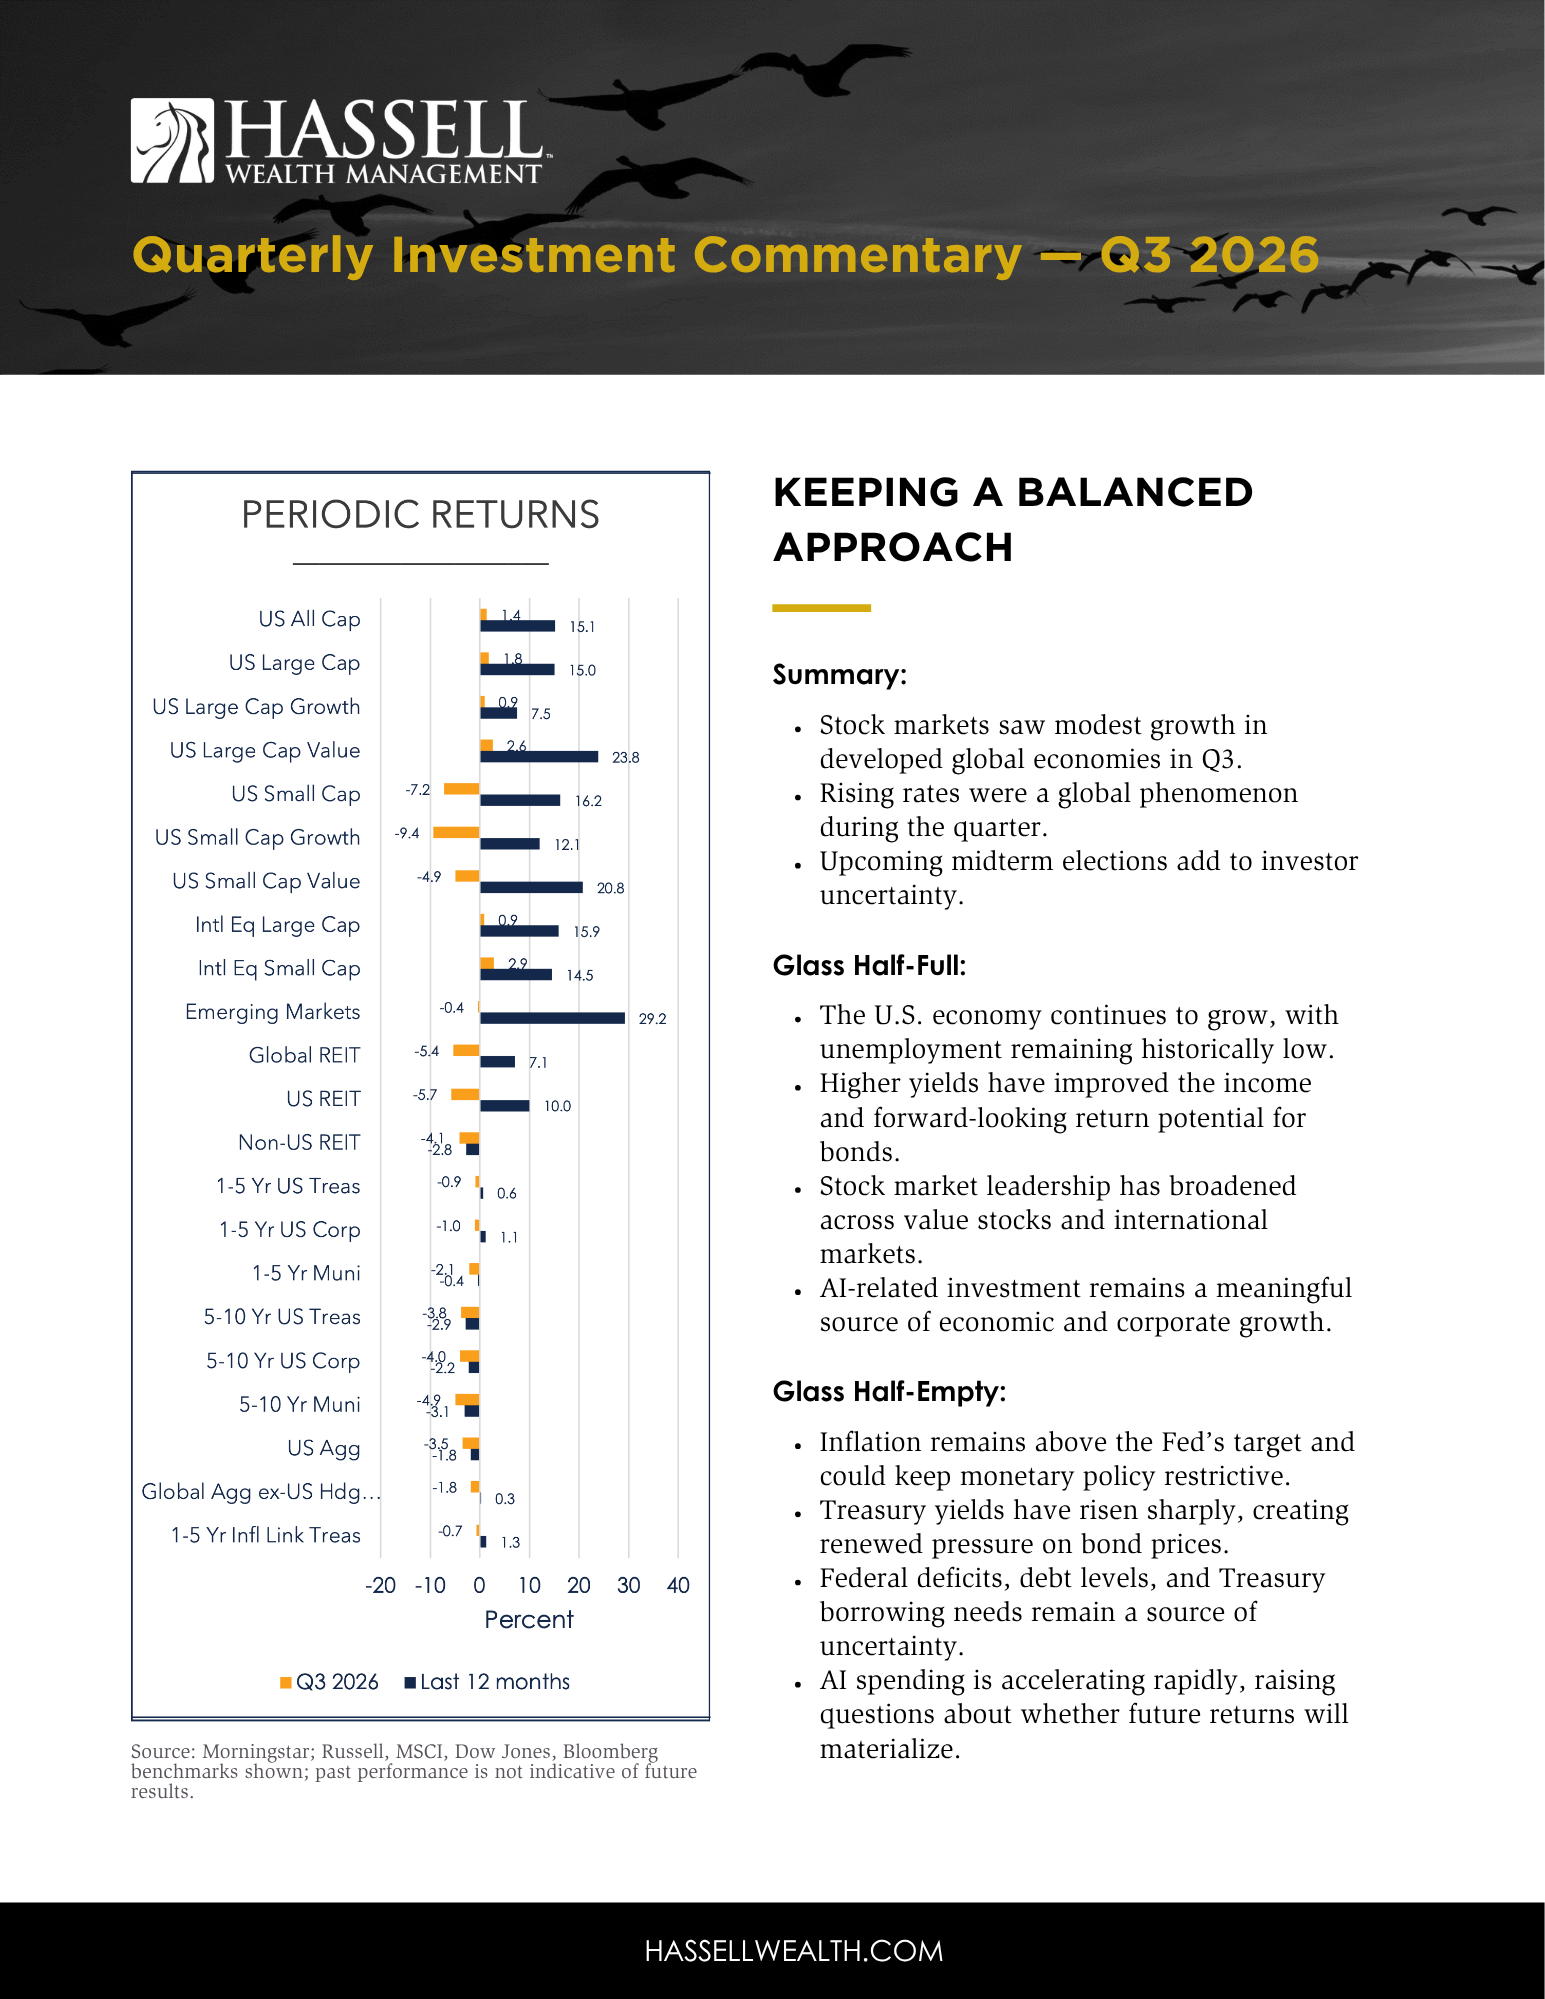
Source: Morningstar; Russell, MSCI, Dow Jones, Bloomberg benchmarks shown; past performance is not indicative of future results.
Summary:
Stock markets saw modest growth in developed global economies in Q3.
Rising rates were a global phenomenon during the quarter.
Upcoming midterm elections add to investor uncertainty.
Glass half-full:
The U.S. economy continues to grow, with unemployment remaining historically low.
Higher yields have improved the income and forward-looking return potential for bonds.
Stock market leadership has broadened across value stocks and international markets.
AI-related investment remains a meaningful source of economic and corporate growth.
Glass half-empty:
Inflation remains above the Fed’s target and could keep monetary policy restrictive.
Treasury yields have risen sharply, creating renewed pressure on bond prices.
Federal deficits, debt levels, and Treasury borrowing needs remain a source of uncertainty.
AI spending is accelerating rapidly, raising questions about whether future returns will materialize.
Watch the video commentary.
Q3 2026 by the numbers
5.29% is the 10-year U.S. Treasury yield at quarter-end, up from 4.19% at the beginning of 2026 and 4.44% at the beginning of the quarter. The recent rise in yields was one of the dominant market stories of the quarter and a major driver of weak bond returns.
0.6% is the difference in stock market return between unified and split control of Congress and the White House (regardless of party affiliation) dating back to 1871 and suggests politics do not have an outsized long-term impact on markets.
$799 billion is the current consensus estimate for 2026 capital spending by the major artificial intelligence (AI) hyperscalers. That compares with $416 billion in 2025 and illustrates just how rapidly AI-related investment is expanding across the economy.
7.2% is the year-to-date (YTD) return of a portfolio comprising 60% MSCI ACWI and 40% Bloomberg Global Aggregate (hedged USD). In other words, despite unnerving headlines and increased market volatility, a globally balanced portfolio comprising both stocks and bonds has performed well so far this year.
Key Economic Indicators
Core PCE inflation is 3.0%, down slightly from last quarter but still above both last year’s reading and the Federal Reserve’s 2% long-term target.
Inflation-adjusted gross domestic product (GDP) growth is 2.2%, down from last quarter and last year, but still consistent with an expanding economy.
Unemployment ticked down to 4.2%, unchanged from last quarter and slightly below the reading from one year ago.
The U.S. economy continues to present a mixed but generally resilient picture across inflation, growth, and employment as shown in Exhibit 1. Core PCE inflation, the Federal Reserve’s preferred inflation measure, was 3.0% at the most recent reading. While that is slightly lower than last quarter, inflation remains above both its level from a year ago and the Fed’s 2% long-term target. Ongoing pressures from constrained energy supply and strong capital investment related to artificial intelligence continue to complicate the Federal Reserve’s efforts to bring inflation sustainably lower.
Economic growth has moderated from the stronger pace seen over the past year. Inflation-adjusted GDP growth came in at 2.2% at the latest reading, down from 2.5% last quarter and 4.0% a year ago. While the pace of growth has slowed, current levels remain around the economy’s longer-term growth rate and do not suggest a meaningful contraction. Continued business investment, including significant spending tied to the buildout of artificial intelligence infrastructure, has also provided support for economic activity.
The unemployment rate remained unchanged from last quarter at 4.2% and sits slightly below the level from a year ago. By historical standards, the labor market therefore remains relatively strong. Taken together, these indicators suggest that the U.S. economy continues to expand with unemployment contained, but inflation remains above the Federal Reserve’s target. That combination has contributed to higher Treasury yields as investors reassess how long monetary policy may need to remain restrictive.
Exhibit 1
Source: St. Louis Federal Reserve, BLS, BEA. Core PCE readings are as of 8/31/26, 5/31/26, and 8/31/25. Inflation-adjusted GDP growth readings are as of 4/30/26, 1/31/26, and 4/30/25. Unemployment rate readings are as of 9/30/26, 6/30/26, and 9/30/25.
Why Are Interest Rates Rising?
As Exhibit 2 illustrates, interest rates have moved meaningfully higher this year, with the 10-year Treasury rising from roughly 4.2% at the start of the year to just under 5.3% by the end of September. But why exactly has this happened? There isn’t one single explanation. Inflation concerns, including higher energy prices and supply-related pressures, have played a role. At the same time, continued economic growth and strong demand for investment, especially around artificial intelligence projects, have kept upward pressure on rates. And increasingly, investors are also paying attention to the federal government’s large deficits and growing debt burden.
That last point can become somewhat self-reinforcing. Higher interest rates increase future deficits, which means more borrowing. In turn, greater borrowing needs and concerns about the fiscal outlook could cause investors to demand still higher yields. This does not mean the U.S. is suddenly facing an immediate fiscal crisis where the dollar is expected to collapse in value relative to other currencies and interest rates on Treasuries creep into low double-digits. Large deficits and rising debt are not new information, and markets have been aware of these trends for years. Rather, the question is whether investors are beginning to require somewhat more compensation for those risks.
As it relates to inflation, some headlines speculate that recent inflation has been the main or only driver of higher rates. However, longer-term expectations for inflation have not dramatically risen, advancing the idea that there are multiple reasons for the recent rise in interest rates. It’s important to keep in mind that interest rates reflect the cost of capital, and the higher cost of capital seen today raises the return investors require from both bonds and stocks.
Exhibit 2
Source: Board of Governors of the Federal Reserve System (US) via FRED®.
Global Bonds
Returns were broadly negative in bond markets in Q3, with short-term Treasuries and short-term Treasury Inflation-Protected Securities (TIPS) holding up relatively well, declining -0.9% and -0.7%, respectively.
During the past 12 months, short-term Treasuries returned 0.6% and short-term TIPS returned 1.3%, while intermediate- and long-term Treasuries remained negative.
Currency-hedged international bonds declined -1.8% in Q3, compared with -3.5% for the U.S. aggregate bond index, and -4.9% for intermediate-term municipal bonds.
During the trailing year, international bonds (hedged USD) were slightly positive at 0.3%.
Exhibit 3
Source: U.S. Department of the Treasury. Data as of 9/30/26, Average represents average daily values per maturity during the listed time period due to data availability. Note: not all maturities populated values for every trading day during the period due to Treasury issuance differences.
Are U.S. Treasuries in Trouble?
With the rise in interest rates, and knowing there’s inherent uncertainty about where rates might go next, investors are now asking if there’s trouble in the Treasury market as certain media headlines imply. Exhibit 3 looks at where the Treasury yield curve stands at the end of Q3 and how it has evolved over time.
The orange line shows the Treasury yield curve at the end of September 2020, when the Federal Reserve had cut short-term rates to essentially zero and was using extraordinary monetary policy support in response to COVID. Yields across the curve were exceptionally low, with even the 30-year Treasury yielding less than 1.5%. The blue line shows where Treasury yields stand at the end of the most recent quarter. Rates are clearly much higher than they were during the COVID-era lows, and they are also above the average daily yields since 1990 shown by the dashed gray line. That can understandably raise concerns that today’s higher rates are signaling stress in the bond market or broader concerns about U.S. fiscal and monetary conditions.
But it is important to distinguish between rates being higher than the recent past and rates being historically extreme. Looking back to 1990, the highest observed Treasury yields for these maturities were roughly in the 8% to 10% range. In other words, while today’s roughly 4.5% to 5.75% yields are elevated relative to the long-term average, they remain well below levels the Treasury market has experienced in the past.
The same is true when isolating the 10-year Treasury yield, a popular benchmark in financial markets, and looking at it back to the early 1960s. In fact, from roughly the late 1960s through the mid-to-late 1990s, the 10-year Treasury spent essentially all of its time above today’s level. In the early 1980s, yields even moved above 15% (though inflation was also much higher then).
So, while a 5% Treasury yield may feel high after the past 20 years, history suggests that the ultra-low-rate environment was actually more unusual. We know rising yields can hurt bond prices in the short run, which has contributed to recent weak bond performance. But there is also a silver lining to higher yields as they mean investors are earning more income going forward. That creates a kind of self-healing mechanism for bonds. As bonds mature and cash flows are reinvested at higher rates, that additional income can help offset earlier price declines and improve future return potential. And by emphasizing short- to intermediate-maturity bonds, which are less sensitive to changes in interest rates than longer-term bonds and can reinvest their maturing proceeds more quickly, investors can also help promote greater stability within the fixed-income portion of a portfolio.
So, higher rates can create short-term pain, but they also make the long-term outlook for high-quality bonds more attractive.
Is It 2022 All Over Again?
With all of this in mind, investors might find themselves wondering whether today’s bond market could become 2022 all over again. If you need a refresher, 2022 was a very bad year for bonds, with the Bloomberg US Agg declining by 13% for the year. There are some important reasons for optimism, but we also have to acknowledge that no one can predict the path of interest rates with certainty. The biggest difference between 2022 and today is the starting point. In early 2022, the 10-year Treasury yielded just 1.63%, and by October 2023 it had risen to nearly 5%, a more than threefold increase. That was a dramatic reset from very low yields and created significant price pressure for bond investors. So far this year, the move has been much more subdued, from 4.19% to 5.29%. Today’s starting yields are already much higher, and the magnitude of the rate increase has been far less dramatic. The starting point matters because in 2022, there was very little income to offset the price drops that came with rising yields. Today, with starting yields much higher, there is more income to offset price drops.
There are still reasons for caution. Inflation remains a concern, and if it proves more persistent than expected, rates could move higher again. More broadly, future rate paths are unpredictable. That uncertainty is one reason we continue to favor short- to intermediate-maturity bonds. They are generally less sensitive to rising rates than longer-term bonds, which can help promote stability if yields move sharply higher again. At the same time, shorter maturities turn over more quickly, allowing investors to reinvest sooner at higher yields.
Are Rising Rates a U.S.-Only Thing?
To be brief, no, rising rates are not unique to the U.S. during Q3 or 2026. In looking at 10-year government bond yields from select developed countries around the world, such as France, the U.K., Germany, and Japan, yields in each of these countries have been rising so far this year, as has been the case since 2022. To end the quarter, France and the U.K. had comparable yields to the U.S., but importantly, interest rate levels and the specific timing of rate changes among these countries and others have not followed each other in perfect unison throughout history. Because of this, international bonds can provide diversification opportunities relative to a U.S.-only approach.
Are Munis Immune to Rising Rates?
To conclude the discussion on bond performance and interest rate movements, it’s important to discuss municipal bonds. Recent changes in the muni bond yield curve are shown in Exhibit 4. It’s important to remember that municipal bonds and Treasuries represent two different government bond markets and are relatively distinct from each other, exposed to certain unique risks, and can behave differently as a result.
Exhibit 4 shows that the muni yield curve has risen substantially in just one quarter, leading to negative performance in Q3 and the worst quarterly return for the Bloomberg municipal index (-6.4%) since 1981, per Nuveen. Among potential reasons for this shift along the muni curve is that municipal bond issuers saw the potential for elevated interest rates coming and chose to increase bond issuance at then-lower rates to lock in cheaper financing, which led to increased supply relative to demand. Because muni bond issuance is typically lower in Q3 each year relative to other quarters, this unexpected increase in supply relative to demand may have pushed yields higher anyway. It’s also possible that increased inflation expectations flowed through to muni yields as well. Various muni fund asset managers have expressed their belief that municipal credit is still strong, so the increase in yields is likely not coming from deteriorating credit conditions.
Exhibit 4
Source: Bloomberg, Avantis. Data as of 9/30/26.
And like in Treasuries, this rate increase can cause short-term pain via negative performance for municipal bonds, but it also creates an appealing entry point for muni investors going forward.
Global Real Estate Investment Trusts (REITs)
Global REITs, as represented by the Dow Jones Global Select REIT index, declined -5.4% during Q3 and were up 7.1% over the past 12 months.
U.S. REITs declined -5.7% during the quarter and were up 10.0% over the past 12 months.
U.S. Stocks
The broad U.S. stock market gained 1.4% in Q3. Large-cap value led the major U.S. segments at 2.6%, while large-cap growth returned 0.9%.
Small-cap stocks were the weakest area of the U.S. market during the quarter. Small-cap growth fell the most at -9.4%, and small-cap value declined -4.9%.
During the past 12 months, the broad U.S. market gained 15.1%. Large-cap value returned 23.8% and small-cap value returned 20.8%, while large-cap growth lagged at 7.5%.
The quarter was another reminder that leadership can change quickly. Small-cap stocks had been among the strongest performers in the prior quarter, but Q3 saw leadership shift back toward larger companies and value stocks.
Non-U.S. Stocks
Developed international stocks gained 0.9% in Q3, while emerging markets declined -0.4%. Developed small-cap value led the international segments at 5.7%, followed by large-cap value at 3.7%.
Developed international large-cap growth declined -1.9% for the quarter, highlighting the advantage value stocks held over growth stocks outside the U.S.
Over the past 12 months, emerging markets gained 29.2%, while developed international stocks returned 15.9%. Developed large-cap value returned 24.3% over the same period.
International and emerging markets have provided meaningful returns during the past year. Broad global diversification allows investors to participate in those growth opportunities without needing to forecast which country, size segment, or style will lead next.
Do Rising Interest Rates Affect Stocks?
Even though interest rate movements are typically associated with questions on bond performance, there’s a natural question in today’s higher-rate environment: If bonds are offering more attractive yields, does that make stocks less attractive? First, markets are generally efficient. Current interest rates are already reflected in stock prices and valuations. This means that investors would have to have quicker, more reliable access to information about future rate changes and how they might affect stock prices over the long term to try to beat the market going forward. This requires that a number of difficult conditional questions be answered.
Second, higher rates can also mean higher expected stock returns. When the risk-free rate rises, investors generally require more return for taking stock risk as well. So the expected return premium for stocks over bonds does not necessarily disappear just because bond yields are higher. Historically, the average annual equity premium was about 8.1% when short-term rates were above their median and 9.9% when rates were below the median, according to research by Dimensional Fund Advisors. But that difference is not statistically reliable due to rate changes alone.
And that leads to the third point: Interest rates are only one of many factors that affect stock returns. Earnings growth, valuations, economic conditions, and investor expectations all matter too. So while today’s higher yields improve the opportunity set in fixed income, the evidence does not suggest investors should materially change their stock-bond mix simply because rates are higher.
Are AI Stocks Now a Risk or Still an Opportunity?
AI has become and continues to be a major driver of both markets and the broader economy. The biggest cloud and technology companies are spending enormous amounts on data centers, chips, networking, and other infrastructure needed to support AI. Capital spending reached more than $400 billion in 2025 and is expected to rise sharply again in 2026 and beyond, with new estimates being revised higher still. That trend suggests the AI buildout is still very much underway.
However, there has been a recent change in how the buildout is being financed. Early on, these AI-hyperscale companies, such as Amazon, Meta, Oracle, and others, were able to fund much of the investment through the strong cash flow generated by their existing businesses. That is an important difference from past investment booms that relied much more heavily on debt. However, recently, the buildout has become increasingly funded by corporate debt, and if spending continues to rise faster than cash flow, companies may need to borrow more, and there is always the possibility of overbuilding or spending too much before the economic benefits fully materialize.
So far, the combined stock return year-to-date in 2026 for AI hyperscaler companies is about 7%, according to JPMorgan, which pales in comparison to their returns of the past few years as the market’s opinion has become more critical.
But there is also a clear opportunity. Demand for AI computing continues to grow, and the spending is creating potential beneficiaries across semiconductors, data centers, networking, power generation, and other parts of the supply chain and economy.
Do Politics Affect Stock Returns?
With midterm elections quickly approaching, many investors are asking how the November elections might affect their stock portfolios. History suggests that political parties and their control of the White House and Congress do not have a reliable influence on long-term stock returns. According to Avantis, median annualized price returns since 1871 for U.S. stocks were 5.8% under unified Republican control, 5.3% under unified Democratic control, and 5.9% under split-party control. This reinforces the importance of avoiding politics when making investment decisions.
East Bay Investment Solutions, a Registered Investment Advisory firm, supplies investment research services under contract.
This document contains general information, may be based on authorities that are subject to change, and is not a substitute for professional advice or services. This document does not constitute tax, consulting, business, financial, investment, legal or other professional advice, and you should consult a qualified professional advisor before taking any action based on the information herein. This document is intended for the exclusive use of East Bay clients, and/or clients or prospective clients of the advisory firm for whom this analysis was prepared in conjunction with the EAST BAY TERMS OF USE, supplied under separate cover. Content is privileged and confidential. Information has been obtained by a variety of sources believed to be reliable though not independently verified. To the extent capital markets assumptions or projections are used, actual returns, volatility measures, correlation, and other statistics used will differ from assumptions. Historical and forecasted information does not include advisory fees, transaction fees, custody fees, taxes or any other expenses associated with investable products unless otherwise noted. Actual expenses will detract from performance. Past performance does not indicate future performance.
The sole purpose of this document is to inform, and it is not intended to be an offer or solicitation to purchase or sell any security, or investment or service. Investments mentioned in this document may not be suitable for investors. Before making any investment, each investor should carefully consider the risks associated with the investment and make a determination based on the investor’s own particular circumstances, that the investment is consistent with the investor’s investment objectives. Information in this document was prepared by East Bay Investment Solutions. Although information in this document has been obtained from sources believed to be reliable, East Bay Investment Solutions does not guarantee its accuracy, completeness, or reliability and are not responsible or liable for any direct, indirect or consequential losses from its use. Any such information may be incomplete or condensed and is subject to change without notice.
Visit eastbayis.com for more information regarding East Bay Investment Solutions.