
KEEPING A BALANCED APPROACH
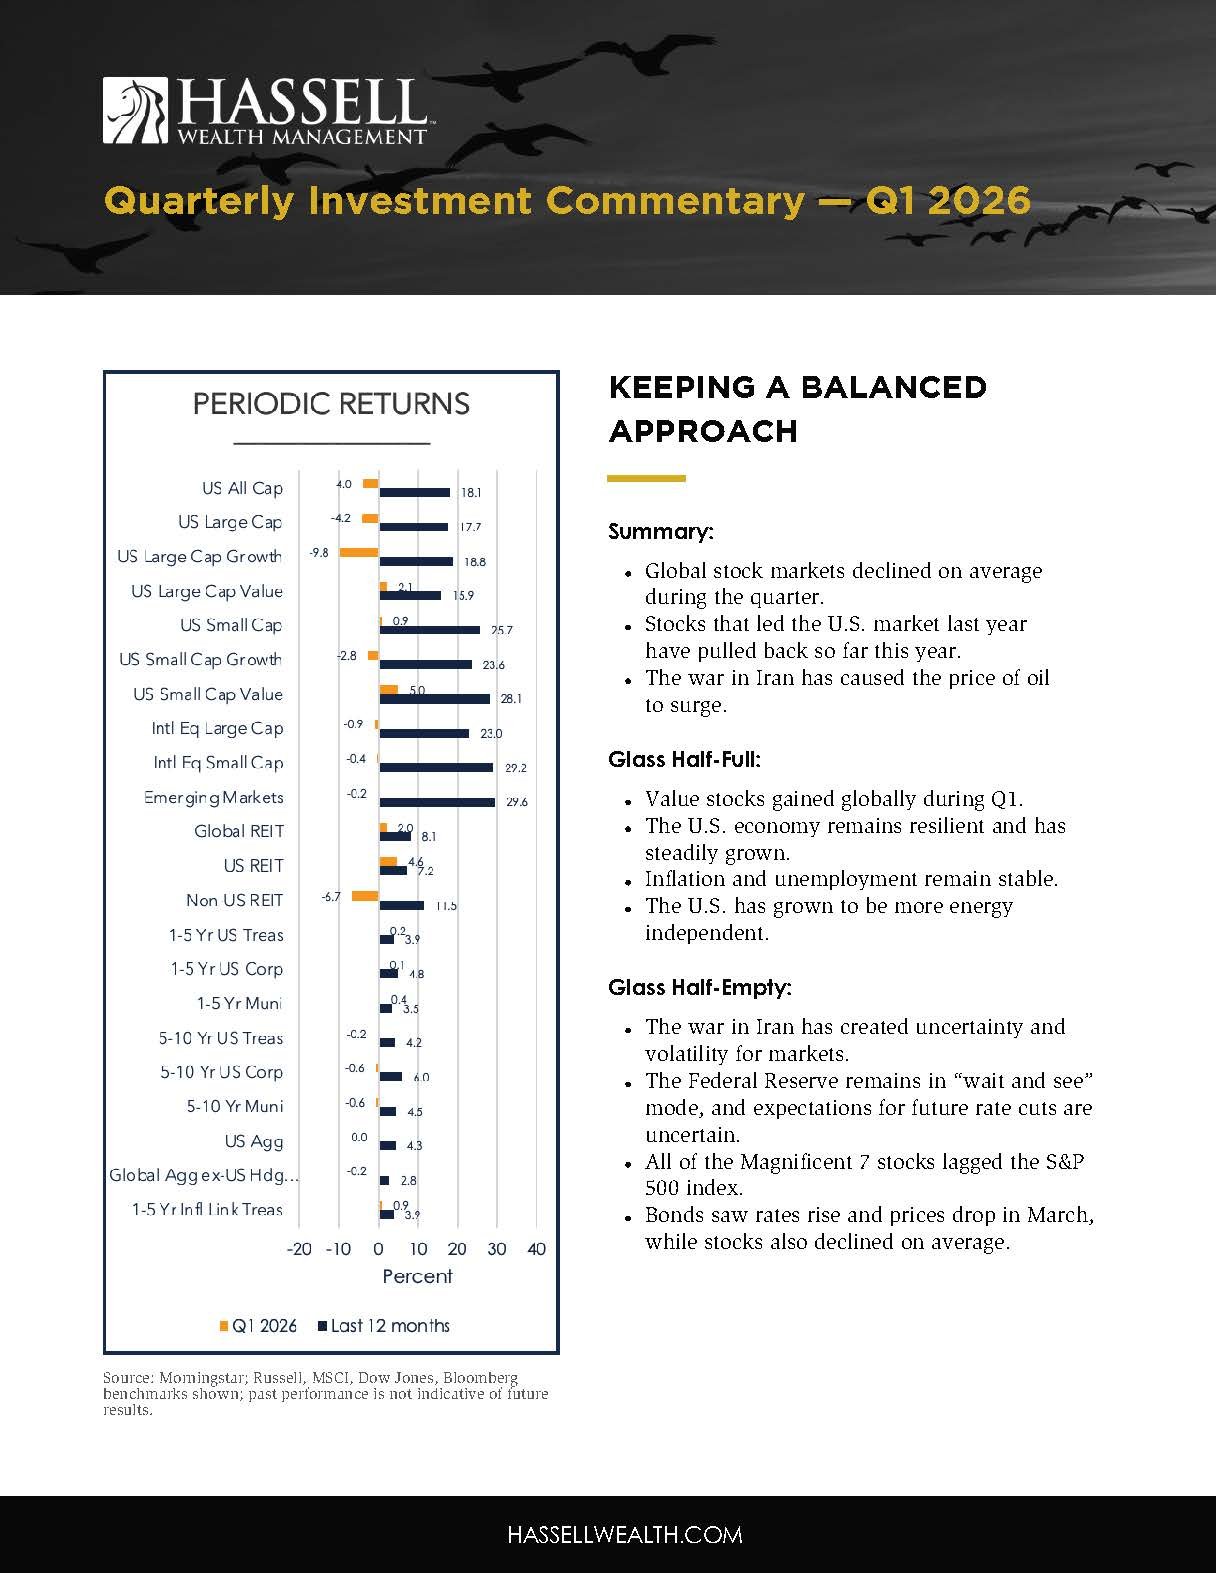
Source: Morningstar; Russell, MSCI, Dow Jones, Bloomberg benchmarks shown; past performance is not indicative of future results.
Summary:
Global stock markets declined on average during the quarter.
Stocks that led the U.S. market last year have pulled back so far this year.
The war in Iran has caused the price of oil to surge.
Glass half-full:
Value stocks gained globally during Q1.
The U.S. economy remains resilient and has steadily grown.
Inflation and unemployment remain stable.
The U.S. has grown to be more energy independent.
Glass half-empty:
The war in Iran has created uncertainty and volatility for markets.
The Federal Reserve remains in “wait and see” mode, and expectations for future rate cuts are uncertain.
All of the Magnificent 7 stocks lagged the S&P 500 index.
Bonds saw rates rise and prices drop in March, while stocks also declined on average.
Watch the video commentary.
Q1 2026 by the numbers
8% is the average one-year total return for the U.S. stock market following the onset of geopolitical events. Investors who choose to “do something” by selling stocks in response to such events tend to miss out on the market’s recovery and future growth.
20% represents the amount of the world’s oil supply that passes through the Strait of Hormuz, a critical shipping lane that has been effectively closed during the war in Iran. Oil prices surged in Q1 as a result, but oil prices and their long-term effect on stock market returns have not shown a strong historical causal relationship.
8 is the number of well-known, large, tech-related companies that underperformed the S&P 500 index in Q1. The collection of stocks, previously the “Magnificent 7,” welcomed a new member to the group, now known by some as the “Hateful 8.”
-1.9% is the year-to-date (YTD) return of a portfolio comprising 60% MSCI ACWI and 40% Bloomberg Global Aggregate (hedged USD). In other words, despite the unnerving headlines and increased market volatility, a globally balanced portfolio composed of both stocks and bonds is down just slightly this year.
A WAVE OF ECONOMIC HEADLINES
Inflation-adjusted U.S. gross domestic product (GDP) growth slowed to 0.5% for the final reading for Q4.
The Fed remains in “wait and see” mode.
So far this year, the U.S. economy has shown resilience amid fresh uncertainty stemming from the war in Iran, among other factors. Economic growth as measured by inflation-adjusted GDP, a gauge of how many goods and services are produced domestically, continues to show positive readings, albeit at a slower rate than last year. At the same time, inflation and unemployment remain in check, giving the Federal Reserve more time to assess future economic trends before making decisions on the federal funds rate and reinforcing Fed Chairman Jerome Powell’s “wait and see” strategy. Nonetheless, the Fed’s preferred measure for inflation, the Core Personal Expenditures (CPE) index, remains elevated at 3.0% and above the long-term 2.0% target. Taken together, these data points and trends indicate that the Fed still finds itself walking a tightrope in managing inflation without stifling economic growth to the point that unemployment rises.
As shown in Exhibit 1, investors have been faced with a constant wave of economic headlines and data points since 2020.
While the range for each data point listed in the exhibit has varied widely over the past five years, the most recent reading (gold dot) shows that each economic indicator has remained within range during this time. And more importantly, these economic indicators and the economy at large show what has already happened, while stock and bond markets look at what is likely to happen. Said differently, economic indicators represent a point in time, whereas investment markets are a look into the future. Markets take what is known today, along with assumptions for what might happen in the future, and set prices accordingly. As new information becomes available, markets rapidly adjust prices. Therefore, if you are looking to make portfolio decisions based on today’s economic indicators, markets are already at least one step ahead of you.
Exhibit 1
Data from 1/1/2020– 3/31/2026. GDP Source: U.S. Bureau of Economic Analysis (BEA) and the Federal Reserve Bank of Atlanta’s GDPNow.
U.S. Unemployment Source: U.S. Bureau of Labor Statistics (BLS). U.S. Inflation Source: U.S. Bureau of Labor Statistics (BLS) and the Federal Reserve Bank of Cleveland’s Inflation Nowcasting. Brent Crude, WTI Crude, and U.S. Average Gasoline Price Source: U.S. Energy Information Administration (EIA).
Conflict Can Cause Uncertainty
Perhaps the most pronounced theme in Q1 was the war in Iran. The conflict provided a fresh dose of uncertainty for stock markets, which tend not to like uncertainty and were down on average for the quarter. Therefore, it’s useful to take a look at how markets have fared in prior geopolitical conflicts and highlight that investors’ strong urge to “do something” in response to conflict tends not to be rewarded over the long term. Exhibit 2 shows returns of the S&P 500 index at the start of some notable geopolitical conflicts dating back to the 1960s. This is not an exhaustive list by any means, and each event took place under a different macroeconomic backdrop. For example, in 2022, when Russia invaded Ukraine, the initial sell-off, as measured by the gold bar, and the subsequent six- to 12-month returns were also influenced by a period of rapidly rising interest rates and inflation, meaning that the invasion itself was not the only thing influencing markets at the time. In general, these sell-offs are usually driven by investor uncertainty about how severe or prolonged the conflict might be, rather than by true economic fundamentals for the companies making up the S&P 500 or any other index. Importantly, markets are forward-looking, and as more information becomes available, the range of possible outcomes narrows, and markets begin to stabilize. We can see this evidence on the left-hand side of Exhibit 2, as we observe the positive overall growth of markets in the six- and 12-month periods following most of the events listed. If investors had reduced their stock allocations at the beginning of such conflicts, waiting for uncertainty to subside, they would likely have missed out on the market recovery and future growth.
Exhibit 2
Past performance is no guarantee of future returns. The performance of an index is not an exact representation of any particular investment, as you cannot invest directly in an index.
Sources: Vanguard calculations as of December 31, 2024, using data from Refinitiv.
Notes: Returns are based on the Dow Jones Industrial Average through 1963 and the Standard & Poor’s 500 Index thereafter. All returns are price returns. Not shown in the above charts, but included in the averages, are returns after the following events: the Suez Crisis (1956), construction of the Berlin Wall (1961), assassination of President Kennedy (1963), authorization of military operations in Vietnam (1964), Israeli—Arab Six-Day War (1967), Israeli—Arab War/oil embargo (1973), Shah of Iran’s exile (1979), U.S. invasion of Grenada (1983), U.S. bombing of Libya (1986), First Gulf War (1991), President Clinton impeachment proceedings (1998), Kosovo bombings (1999), September 11 attacks (2001), multi-force intervention in Libya (2011), U.S. anti-ISIS intervention in Syria (2014), and President Trump impeachment proceedings (2019 and 2021).
Oil Price Changes and Stock Market Returns
Oil and energy prices are front and center in today’s war in Iran, with the price of oil increasing substantially during the quarter as the Strait of Hormuz, a critical shipping lane responsible for the movement of 20% of the world’s oil supply, has been effectively closed so far in the conflict. This may have tempted some investors to buy oil- and energy-related companies expected to profit more from increases in the prices of commodities they help produce, transport, and sell. To investigate this potential relationship, Dimensional Fund Advisors analyzed changes in crude oil prices for each calendar year dating back to 1964 and compared them with the stock returns of companies in the energy sector. Perhaps surprisingly, the idea that higher oil prices mean more profits for energy-producing companies (and more returns for their shareholders) does not seem to hold up historically. For example, when the price of oil increased by more than 150% in 1974, the energy sector of the stock market fell more than 20%. And even though oil prices dropped in 2025, the energy sector of the stock market was up. Taking this one step further, if oil prices are a poor predictor of energy company stock returns, it’s unlikely that changes in oil prices are any better at predicting movements in the broader stock market. Once more, investors are best served by sticking to their long-term plan through periods of uncertainty. As an aside, the U.S. economy has morphed over the years from an oil net-importer to an oil net-exporter, meaning that the country tends to produce and sell more oil abroad than it buys. This potentially mutes the negative economic effects of any dramatic global increase in oil prices that the U.S. might otherwise sustain.
U.S. Equity
U.S. stocks were negative for Q1, losing 4.0%, but were supported by value stocks. Small-cap value stocks gained the most at 5.0%.
Large-cap growth stocks weighed on the U.S. stock market during Q1, losing 9.8%, fueled by losses in large, tech-related companies.
Despite negative performance during the quarter, all U.S. stock asset classes were positive for the past 12 months, with small-cap value stocks returning the most at 28.1%.
Uncertainty in today’s markets stretches beyond geopolitical conflict and oil prices. Dating back to late last year, artificial intelligence companies have come under the market’s broader scrutiny, namely those in the Magnificent 7, a group of high-flying tech stocks represented by Microsoft, Tesla, Meta, Amazon, Apple, Google (Alphabet), and Nvidia. However, the group garnered a new catchy, albeit less flattering, nickname —the “Hateful 8” — when it welcomed a new member company, Oracle, to the group. The trend that began in Q4 2025, when five of the seven companies underperformed the S&P 500 index, has continued into 2026 and worsened, with all of the Hateful 8 companies losing value this year. Microsoft and newcomer Oracle each lost more than 20% this quarter. For context, the S&P 500 lost 4.3% in Q1, of which Microsoft was responsible for about one-quarter of the index’s overall loss. This highlights the importance of diversification in investor portfolios and of not taking undue company-specific or sector risks.
Non-U.S. Equity
Broad developed and emerging non-U.S. stock market returns were negative for Q1, although they outpaced the U.S. stock market.
International developed large-cap value stocks were the leading stock asset class outside of the U.S. in Q1, returning 2.5%.
Outside the U.S. stock market, international developed and emerging stock markets each bested the U.S. market in 2025 by wide margins. So far this year, their margins of success over the U.S. market haven’t been as dramatic, but they are intact nonetheless and made all the more impressive with the Iran war as the backdrop.
If these geographic performance trends build further over the coming quarters and years, they will impact the makeup of the global stock market. We can see this dynamic playing out in Exhibit 3, which represents the global stock market share for select countries and regions. First, in looking at the U.S. share of the global stock market (i.e., its overall value relative to other regions), we see that for some time now, the U.S. has had and continues to enjoy the top spot in terms of size of collective stock market wealth relative to the rest of the world. But that hasn’t always been the case. Japan, as recently as the early 1990s, represented the bulk of the world’s stock market wealth. However, investors who were certain that Japan would remain the dominant driver of global market returns were sure to be disappointed over the next few decades, as the country's market performance waned even as other countries and regions accelerated. Relating this historical trend to today, it’s important to keep geographic diversification in mind when investing. While we have no way of knowing which country or region will outperform over the next few decades, exposure to the global market helps ensure that investors can benefit from global stock market returns, no matter where they come from.
Exhibit 3
Source: FactSet, MSCI, Standard & Poor’s, J.P. Morgan Asset Management. Guide to the Markets – U.S. Data are as of March 31, 2026.
Global REITs (Real Estate Investment Trusts)
Global REITs, as represented by the Dow Jones Global Select REIT, rose by 2.0% over the quarter and were up by 8.1% over the past 12 months.
In the U.S., REITs rose by 4.6% during the quarter and are up by 7.2% during the past 12 months.
Global Fixed Income
U.S. taxable bond returns were mostly negative during Q1 but still up during the past 12 months, with longer maturities suffering as rates rose. Short-term Treasury inflation-protected securities (TIPS) fared best during the quarter, rising 0.9%.
International bonds ex-U.S. (hedged USD) were also negative over the trailing quarter (-0.2%) but positive for the past 12 months (2.8%).
Short-term municipal bonds were positive for the quarter (0.4%) and one-year trailing time periods (3.5%), while intermediate-term munis were down for the quarter (-0.6%) but up 4.5% for the last 12 months.
Why Did Treasury Prices Decline In March?
Many investors are looking back on the final month of the first quarter and asking themselves why bond prices declined when stock prices did too. It’s a fair question because conventional wisdom suggests that when stock markets experience a down period, investors seek safety in bonds, especially U.S. Treasuries, which are still widely regarded as one of the world’s primary safe-haven assets. But that didn’t happen this time. Ultimately, the expectation that bonds will always increase in value when stocks decline assumes that stock market performance and volatility are the only things that affect bond prices and performance. While this relationship makes some rational sense, it is not a complete understanding of how bonds are priced. The major determinant of a bond’s price is the prevailing market interest rate. As rates rise, previously issued bonds lose value because their stated interest payments at issuance now look somewhat less attractive compared with newer bonds with higher interest payments. The opposite is also true, where bonds increase in value when prevailing market interest rates decline.
So, for investors looking to answer why bonds declined last month at the same time stocks did, we need to consider what actually influenced interest rates at the time and not necessarily at how stock markets performed. One potential reason for the increase in interest rates is the war in Iran’s upward effect on oil and gas prices, which can feed into increased inflation expectations, causing rates to rise. If a market shock is viewed as potentially inflationary, investors will demand added return for this inflation uncertainty, which results in lower stock and bond prices today. On the other hand, if a market shock is viewed as deflationary, such as the early COVID and Great Financial Crisis periods, investors will likely anticipate slowed economic growth and even potential recession. This tends to pull inflation, growth assumptions, and stock prices downward along with interest rates, which in turn boosts bond prices. Other potential causes of last month’s rising interest rates for U.S. Treasuries include continued concerns about the U.S. government's fiscal spending, overall debt levels, and investors looking to buy more non-USD-denominated assets. This dynamic shows that many variables are taken into account when determining a bond’s price and that bond markets do not always increase in value when stocks decline.
Overall, we continue to view our bond allocations as a method of reducing overall portfolio risk (as measured by standard deviation), given that stocks are expected to have much higher volatility. Our portfolio’s focus will continue to be on high-quality bonds with an emphasis on short- to intermediate-duration government and corporate bonds, where default risk has historically been relatively low.
East Bay Investment Solutions, a Registered Investment Advisory firm, supplies investment research services under contract.
This document contains general information, may be based on authorities that are subject to change, and is not a substitute for professional advice or services. This document does not constitute tax, consulting, business, financial, investment, legal or other professional advice, and you should consult a qualified professional advisor before taking any action based on the information herein. This document is intended for the exclusive use of East Bay clients, and/or clients or prospective clients of the advisory firm for whom this analysis was prepared in conjunction with the EAST BAY TERMS OF USE, supplied under separate cover. Content is privileged and confidential. Information has been obtained by a variety of sources believed to be reliable though not independently verified. To the extent capital markets assumptions or projections are used, actual returns, volatility measures, correlation, and other statistics used will differ from assumptions. Historical and forecasted information does not include advisory fees, transaction fees, custody fees, taxes or any other expenses associated with investable products unless otherwise noted. Actual expenses will detract from performance. Past performance does not indicate future performance.
The sole purpose of this document is to inform, and it is not intended to be an offer or solicitation to purchase or sell any security, or investment or service. Investments mentioned in this document may not be suitable for investors. Before making any investment, each investor should carefully consider the risks associated with the investment and make a determination based on the investor’s own particular circumstances, that the investment is consistent with the investor’s investment objectives. Information in this document was prepared by East Bay Investment Solutions. Although information in this document has been obtained from sources believed to be reliable, East Bay Investment Solutions does not guarantee its accuracy, completeness, or reliability and are not responsible or liable for any direct, indirect or consequential losses from its use. Any such information may be incomplete or condensed and is subject to change without notice.
Visit eastbayis.com for more information regarding East Bay Investment Solutions.